

Importance of Diagrams in Anthropology Optional for UPSC Examination
Diagrams have always been a confusing section filled with doubts for the students preparing for UPSC and Anthropology preparation is no exception. This confusion could be a result of our "glorious" school days when we drew diagrams only when we were asked to or of our own apprehension towards arts.
Henceforth, through this article, we try to build a better understanding of the types of diagrams and when & how to use them in Anthropology preparation.
Why Use Diagrams:
Concepts are the abstract core of any idea or theme in any discipline and hence at times, it becomes difficult to explain them only through words. Diagrams are visual representations of concepts and ideas and help to develop a better understanding of the concepts and their various aspects. They can be used to illustrate complex relationships, theories, and models. In anthropology, diagrams can take many forms, including flowcharts, maps, graphs, and tables.
- Saving time - Complex and lengthy explanations can be replaced by colourful visual self-explanatory diagrams with labelling. Diagram especially comes in handy in time-crunch situations, like when the examination is about to be over.
E.g.: During your anthropology preparation, if you have a time crunch for a question on archaeological sites then you may use a map to represent the distribution of sites with labelling. - Memorize concepts - Diagrams represent the contents in a nutshell with all the elements and relationships amongst them. They create a pictorial memory in mind that helps to retain the concept for a longer time and henceforth a boon for anthropology preparation.
- Clear and concise representation of information - Diagrams provide a clear and concise representation of complex information, making it easier for the examiner to understand what the student wants to convey.
E.g.: showing the evolutionary changes through diagrams - Organizing information - Diagrams can help to organize information and make it easier to study. It helps in better structuring and presentation of content.
E.g.: Building an evolution tree with dates to represent human evolution for Anthropology preparation. - Enrichment and visual appeal to answers - Diagrams help to add diversity to the presentation of content amidst monotonous texts and make the answer more visually appealing.
- Reflects the creativity of the candidates - it reflects the creative potential of the candidate to the examiner, which can help in standing out for the candidate.
- Simplifying Complex Concepts - During anthropology preparation, using diagrams can simplify complex concepts and make them easier to comprehend.
E.g.: reflecting social concepts through genealogy diagrams during the Anthropology preparation. - Comparative Analysis - For anthropology preparation, a comparative analysis is essential in understanding how different cultures and societies differ from one another. Diagrams are essential for such purposes.
- Data Visualization - Data visualization is the graphical representation of data and information. For anthropology preparation, data visualization is essential for analysing data and identifying trends.
E.g.: Demographic trends like- life expectancy, population trends, birth and death rates, etc.

Types of Diagrams in Anthropology
There are several types of diagrams that are commonly used in anthropology optional preparation for the UPSC examination. Here are a few examples:
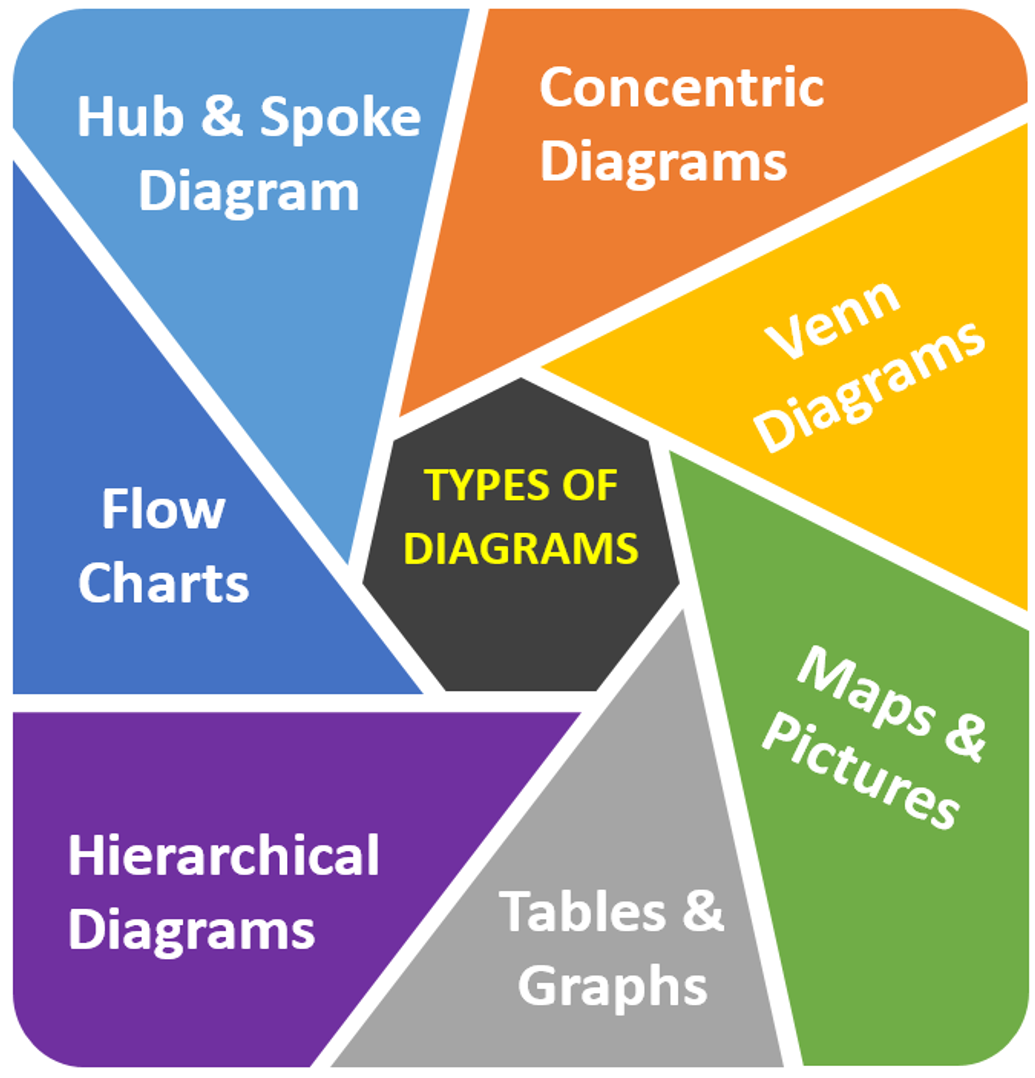
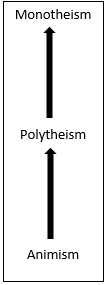
- Flowcharts - Diagrams that illustrate the sequential logic of steps involved in a process. In anthropology, flowcharts can be used to illustrate the stages of cultural evolution or the different stages of the human life cycle.
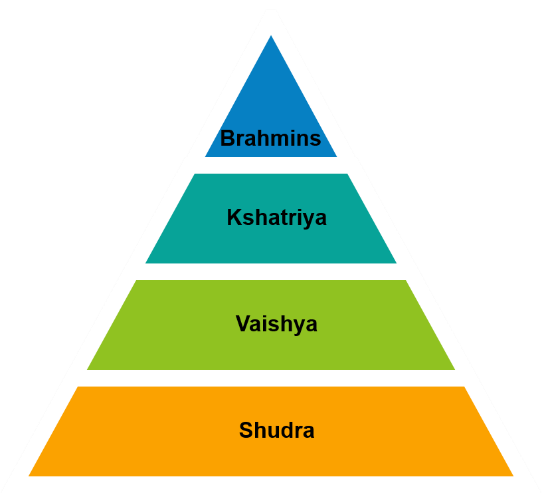
- Hierarchical linkages - It displays the category and sub-category of information. Example: taxonomy, Tracing, and locating the position of man in primate.
- Concentric diagrams - Displays interrelated and independent units of a concept in overlapping circular designs. Example: the endogamy and exogamy marriage types and limits.
- Venn Diagrams - Venn diagrams are especially useful for highlighting similarities and differences and are commonly used to compare and contrast the characteristics of different data sets.
- Maps - Represent the distribution and spatial relationships between different locations. Example: maps can be used to represent archaeological sites, tribal distributions, etc.
- Tables and Graphs - Tables and graphs are diagrams that are used to represent numerical data and to analyse different nuances of the same. Example: To represent demographic data, or morphometric methods under the chapter in races
- Hub and spoke diagrams - it displays smaller components that make up a larger idea or finding, and shows the features of the central idea. Example: 4-fold division of anthropology, Tribal problems – Poverty, education, land alienation
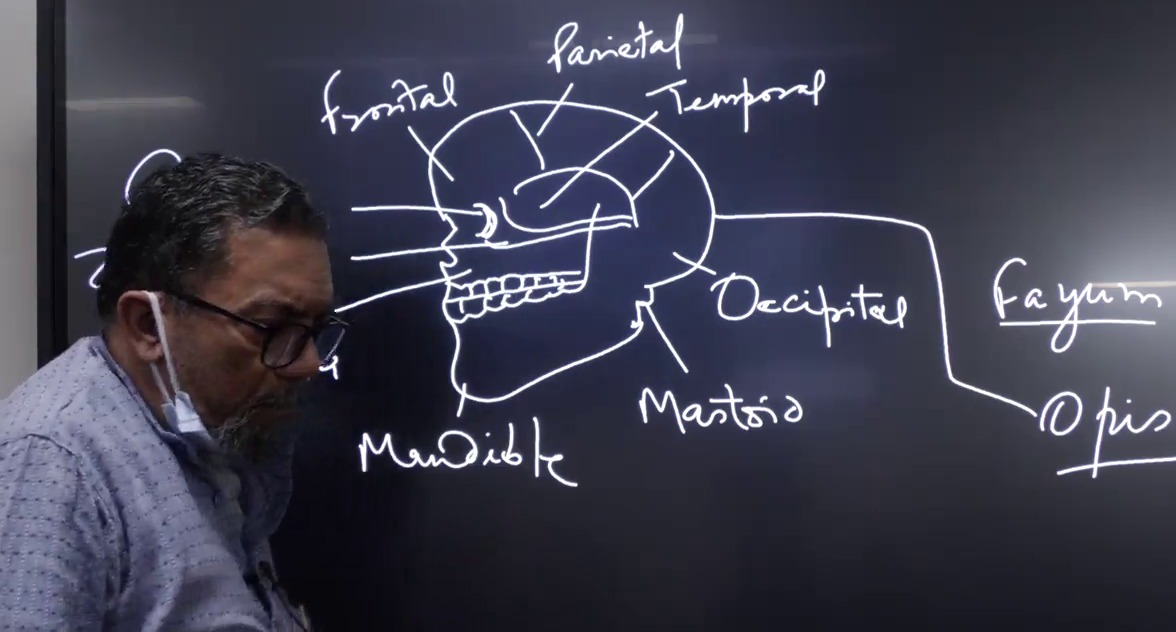
- Picture Diagrams - Different diagrams of the pictures are required to complement the answers like the fossil of the skull when we talk about evolution. Such diagrams need to have appropriate labelling too.
Do’s and Don’ts
- Make a list of all diagrams in your notes
- Keep practising the diagrams as no diagram in the exam should take more than 30-40 seconds.
- Label the diagram properly with essential details.
- Make sure to link the diagrams to the main body of the answer
- Make diagrams on the sides, our purpose is not to consume unnecessary space
- Avoid making diagrams toward the end of the answer
In a nutshell, diagrams are an essential element in anthropology preparation and they have been part of success strategies of every topper. Rather than telling they show the concept to the examiner. They simplify complex concepts, provide visual representations of information, allow for comparative analysis, and help in data visualization. The use of diagrams in anthropology is crucial for students preparing for the UPSC anthropology optional preparation as it can help them save time, improve presentation, memorize content, and finally score good marks.
Frequently Asked Questions (FAQs):
Q1. Is it compulsory to add diagrams to the answers?
A1. No. Add diagrams where it is necessary and serves the purpose. Unnecessarily adding diagrams will make it irrelevant and may even irritate the examiner. As also, wherever the scholars or standard diagrams are there in the book, one should try to incorporate those diagrams in the answer, for instance, diagrams of stone tools, fossils, and skulls.
Q2. Are diagrams and labels part of the answer word limit?
A2. Diagrams and labelling are not counted in the word limit. But it certainly consumes space and time, so be rational while making diagrams
Q3. Can I use colours in the diagrams?
A3. Yes. Students can use colours also if they feel that it will express the diagram better and make it more meaningful. Be cautious that it does not consume much time.
Q4. Is there any limit to the number of diagrams that can be used in the exam?
A4. There is no fixed number of diagrams that be explicitly recommended for adding to the exam. It all depends upon the type and demand of the questions. But keep in mind that diagrams cannot replace the real content. Moreover, diagrams should be relevant, expressive, and meaningful and must serve a purpose in the answer.